Like this article? Share it with your network.
As soon as you enter a store, let’s say you get to view a shelf which has 25 beverage bottles from Brand A and 5 bottles from Brand B. Everything else being equal, which bottle are you likely to pick-up? Studies show most consumers will go for Brand A. Thus, while modern retail is often perceived as the convergence of goods and technology, people are at the center of all commerce activities. Which makes the message clear - What you see is what you buy. Thus, more the share of shelf of a product - the probability of the products' sale increases.
Share of facings on shelf (share of shelf or SoS) is a metric that measures how much of the visibility share is occupied by a brand. The best companies invest a lot of bandwidth in ensuring they get a higher share of shelf (both quality and quantity) and make it as a lever to drive market share growth.
In this article we will discuss everything about SoS and how to improve it based on our experience of working with different CPG companies.
What is Share of Shelf (SoS)?
SoS is the space allocated to a brands’ product in a category, in comparison to other brands’ products placed on that shelf. This space allocation is generally in line with market share of the brand in that category. For example - when it comes to baby creams, a retailer will provide greater SoS to Johnson & Johnson as compared to any other brand. Why? Because JnJ is a consumer favourite when it comes to the baby care range of products and enjoys a high market share. Thus, the retailer capitalizes on its brand value to generate sales for their store.
Different brands calculate SoS differently. Two of the common methods are -
1. Share of facings count - Calculated as a percentage, facings/count is the ratio of the number of SKUs of a particular brand kept on the retail shelf to that of the total SKU count in that category which is present on the shelf.

2. Linear SoS -This is the most commonly used definition for calculating share of shelf and is expressed as a percentage. It's the ratio of the total space occupied on a shelf by the brand’s SKU to that of the total retail shelf space allotted for SKUs of that category. Here’s an example where Linear SoS for beverages is calculated -

What makes Share of shelf important for CPG brands?
When used strategically, SoS studied along with POS data can be leveraged by CPG brands to gain market share.
SoS helps drive user behaviour - When the number of facings of a particular SKU on the shelf are more, the likelihood of the consumer to buy that SKU increases. This leads to improved sales growth and market share gains (assuming everything else is unchanged).
Higher SoS leads to gain in market share - In a simplistic way, one can even argue that getting a higher share of shelf (v/s market share) can kick in a virtuous loop to increase market share.
This is how it will work -
SoS is decided based on the market share of the product in the category and the relationship which a brand enjoys with its retail partner. So, if a brand negotiates a high SoS with the retailer and ensures execution of the plan, eventually it will lead to better sales, gain in market share - which will again help in getting a better SoS deal with its retail partners.
What are the challenges faced by CPG brands in ensuring SoS execution?
Every brand is allocated a retail shelf space. It is in this fixed space where the brand has to decide the distribution of its products - in terms of sizes, variants and product facings.
Deciding SoS for each SKU is a highly nuanced and data driven undertaking - The distribution of SKUs is very specific and is based on the channel. For example - in a hypermarket store, SoS can be spared for many different variants of a product, but in a small convenience store, a brand would want the maximum SoS to go to its hero SKU. Similarly, gourmet stores will have different SKUs, and each will have its designated SoS. SoS distribution is also variable based on different geographies, and the relationship between the CPG manufacturer and the retailer, making it a highly nuanced exercise.

Challenges in effective implementation of Eye-level SoS and SoS for new product launches- Brands also struggle to effectively implement quality SoS KPIs. For example - Eye level SoS means distribution of the allocated space between different SKUs, placed at the eye-level. Often, brands want to provide SoS to their new product launches near their hero SKUs and placed at eye-level to ensure their success. Certain categories like chocolates desire to have SoS near check-out counters to help trigger impulse purchases. But these strategies bear fruit, only if they are implemented diligently on the ground level.
A gap between the decided brand strategy and its execution on ground level - In our experience, we have always seen a gap between the retail execution plans decided by the CPG leadership, and the actual implementation of these plans in reality. Many times, the terms of trade decided between the retailer and the CPG leadership are not fully complied with on the field.
Methods deployed by CPG brands to measure the execution of their SoS programme, is wanting - In order to ensure the terms of trade regarding SoS are implemented, the brands send in their field reps or use third - party auditors to check that their perfect store guidelines are being implemented. However, a lack of accurate SoS measurement mechanism still persists.

Why is that?
Self-reporting by field reps is plagued by errors - the manual methods lack accuracy, not to mention time-consuming. When taking into consideration the modern trade environment - it takes around 20 minutes to calculate SoS for each category.
Also, the field reps are not especially trained for making the correct shelf measurements and expressing the SoS percentage making their findings inaccurate.
More importantly, field reps here essentially rate their own performance at executing CPG guidelines - this opens the entire audit process to manipulation, as field reps are not likely to report when they have underperformed.
Feasibility of third-party audits is always in question - When it comes to deploying third-party auditors - it is too expensive to scale, thus ruling it out as a viable option.
Field reps have to deal with a lack of instant insights - by the time they report their issues to the CPG HQ, the ground realities for that particular store may change
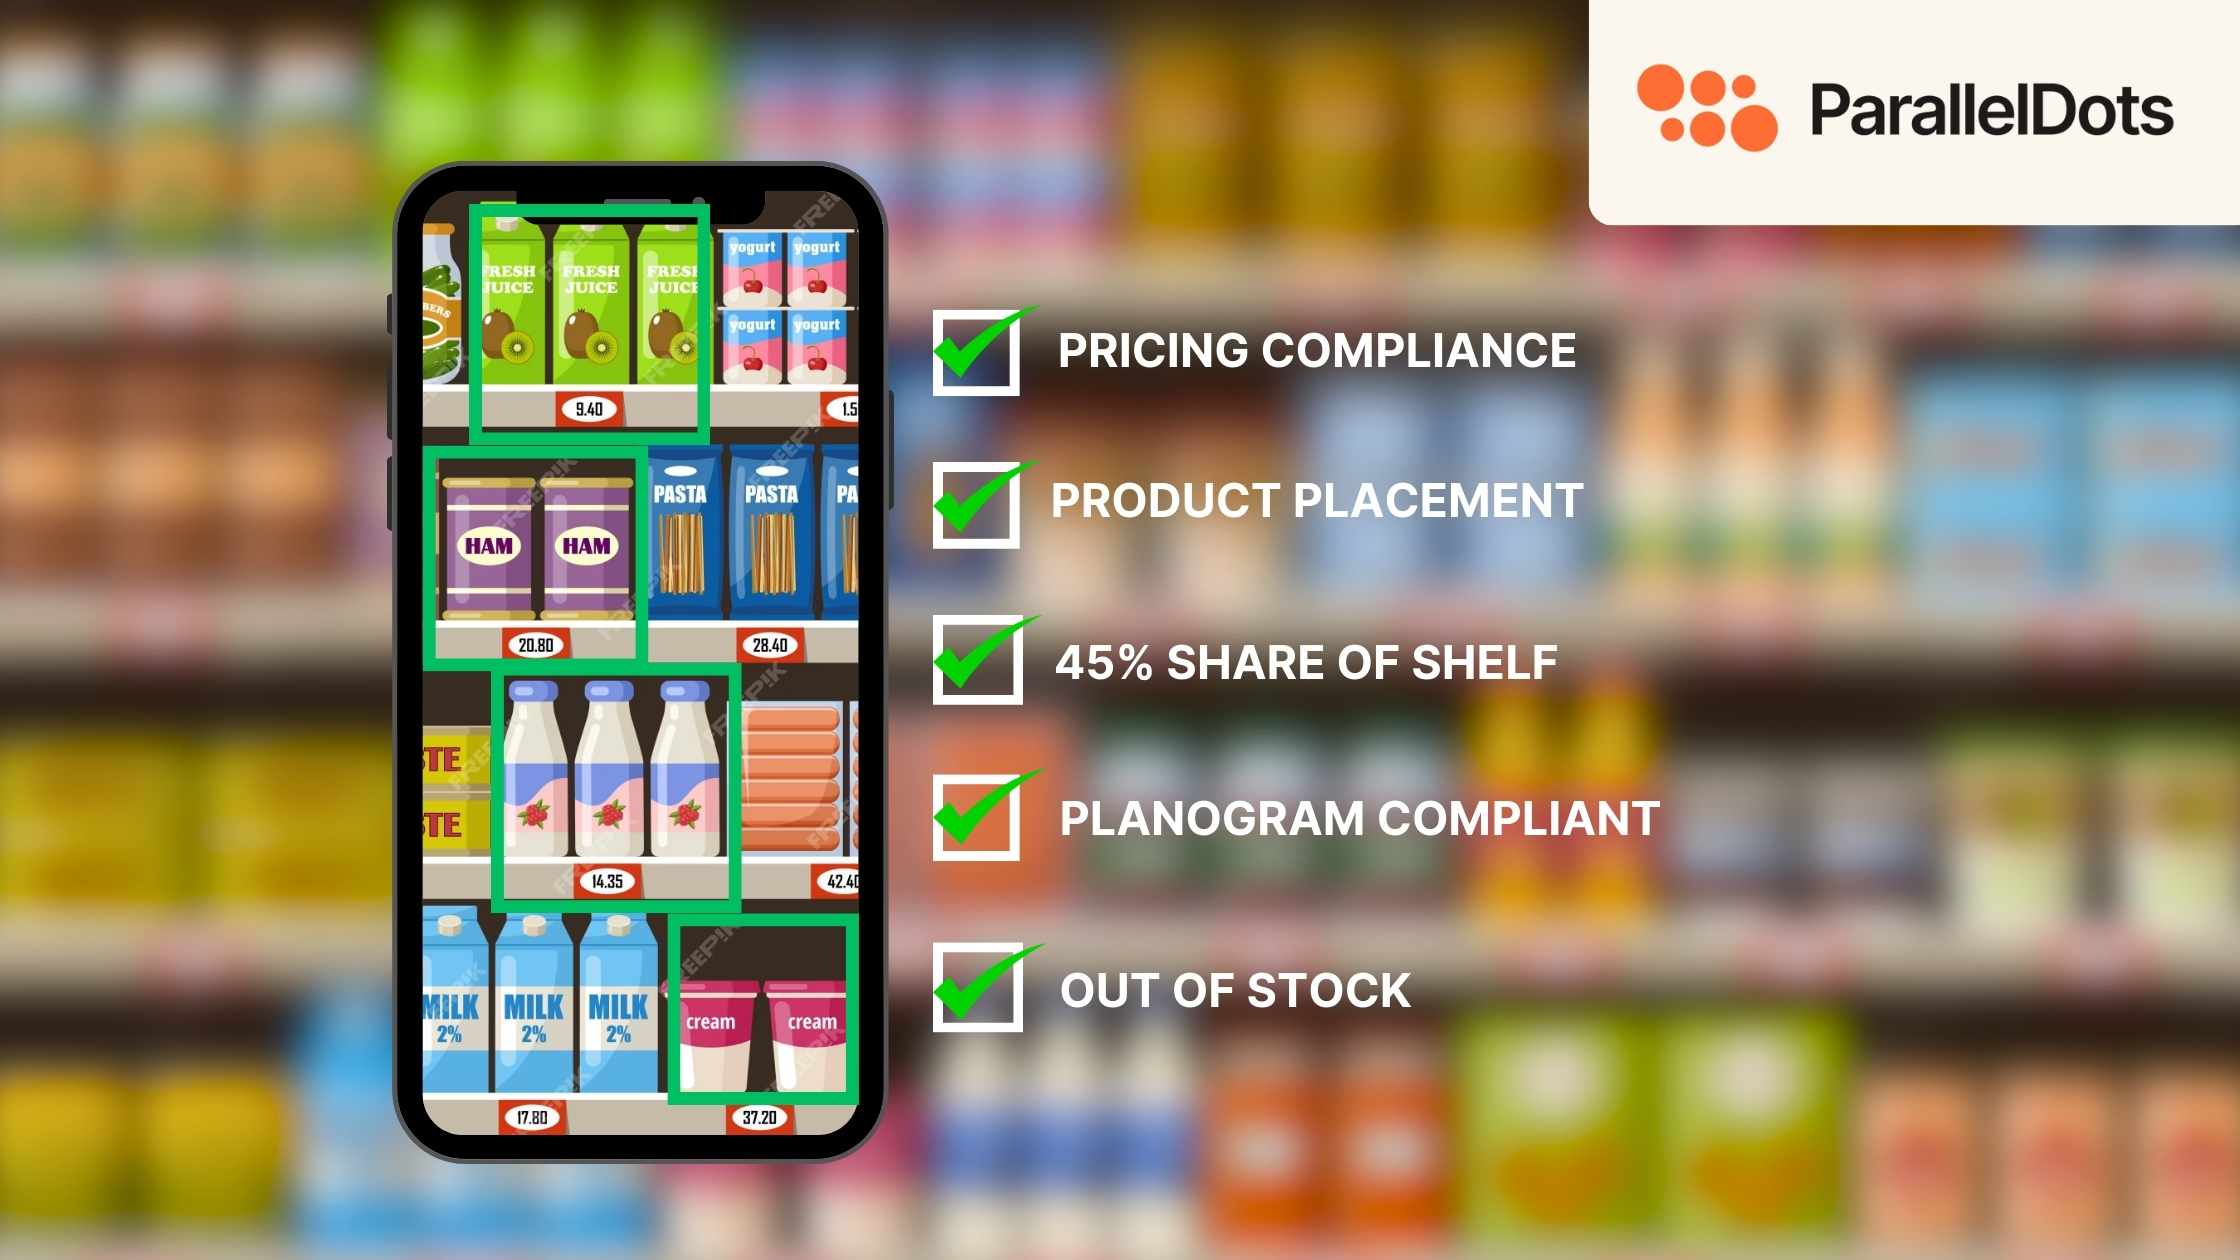
How Image Recognition helps CPG brands perfect their SoS meaurement prgramme -
Image recognition instantly identifies the relevant SKUs and calculates the SoS for the brand – thereby becoming almost like an assistant to the field rep. SoS scores for that SKU are immediately computed, and the sales rep is able to rectify the issue, thus improving retail execution.
Image recognition and AI technology helps in providing real-time insights and put in action, a virtuous feedback loop mechanism - It creates a robust redressal mechanism in the form of a virtuous feedback loop. It gives real-time SoS insights to both the sales rep and the CPG leadership. The sales rep is able to solve the issue immediately in the store, and simultaneously the AI also relays the issue to the CPG HQ. The brand leadership has a dashboard which has access to the SoS calculated, and they communicate with both the sales rep and the retailer to improve their SoS execution.
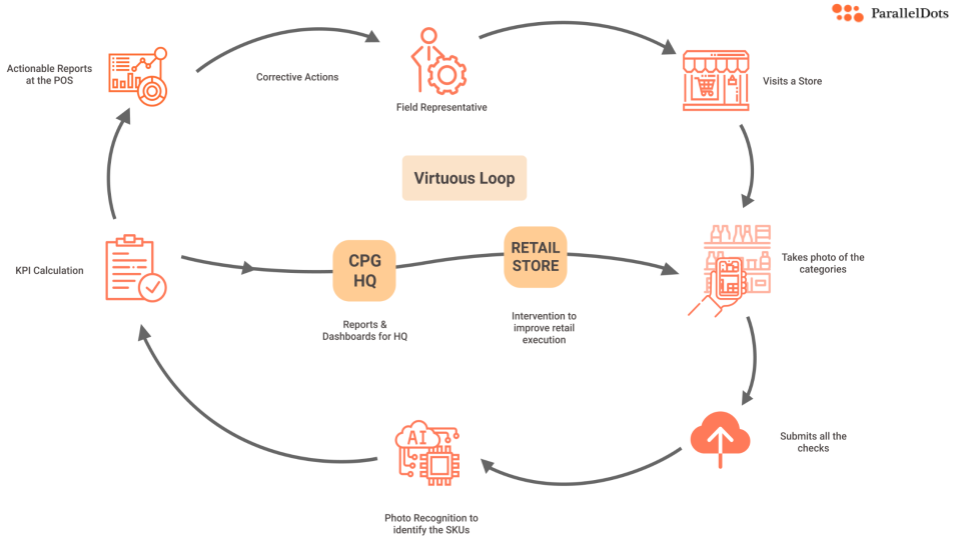
Image recognition solutions like ShelfWatch can also be customized to create a scorecard - All the brand has to do is set SoS compliance targets for its sales reps and retail partners. Depending on the targets achieved by them, a scorecard is created. This makes it easy to discern the underperforming field reps. It also pinpoints which retailers are not distributing the stock as decided by the SoS terms of trade with the brand. The scorecard is also used to identify where the targets have been achieved, and using it as a base, incentives/bonuses can be determined.
Image recognition thus helps in creating a KPI driven organization, where performance is valued, and adequately rewarded through incentives.
Things to keep in mind when implementing the SoS measurement program for perfect retail execution -
Having worked with many CPG brands and retailers in achieving their perfect store execution, we highlight certain practices that can help you build an effective SoS measurement programme.
Brands should track eye-level SoS as a KPI for their focus SKUs - This can be a lever used to drive behaviour change and get users to try new products or upgrade to premium ones so as to improve ARPU. Moreover, new launches can be included under a separate KPI called New Launch SoS – and they can be aggressively tracked to ensure product success.
Excluding products kept on secondary visibility assets - For finding out what the true product lift-off is without the garnish of a POSM (Point of sales material) to aid an SKU’s sale - it's important to exclude secondary visibility when calculating SoS numbers. A brand pays the retailer to keep point of sale material in the store, and it is expected that the retailer will follow the terms of trade and keep only that brands’ SKU in the secondary assets like end-cap shelves, hangers, floor-stacks or gondolas. The real battleground is the primary shelf - and its this organic SoS that the brand should measure.
Stacked products should not be included in SoS measurement - When performing linear SoS measurements, the products stacked above each other on the shelf should not be considered.
Image Recognition solutions should be able to capture and stitch entire shelves for SoS calculations - When using image recognition solutions to calculate SoS, field reps capture images of only their brands’ products, and not the entire category. This leads to a fundamental issue - Say, if the shelf is long and the field rep takes an image of a small portion of the shelf, which mainly has their SKUs - SoS percentage for that brand will look high. But when you take the entire shelf into account which houses many other soap brands, now the denominator increases thus giving the correct SoS percentage.

ParallelDots ShelfWatch deals with this issue, by providing the brands with the image stitching feature. Which means when the field rep captures a long bay in multiple images - ShelfWatch AI will stitch them altogether in the correct sequence and give the entire shelf in one single image for SoS calculations.
Measuring SoS when boundaries between categories are unclear - There are stores which have an entire shelf dedicated to soaps. In this case, the category of soap is clearly defined. But in some cases, such clarity may be absent.
For example - hand sanitizers. Seldom stores will provide it with a distinct shelf area. When using image recognition solutions, instead of capturing the entire shelf (here the shelf may include SKUs that are not-related to hand-held sanitizers), what brands can do is to calculate the SoS of their top 3 competitors in the hand-held sanitizer category and then compare numbers. Such comparison will give them competition insights, and will also help guide their product placement strategy.
Competition SoS figures should be considered when creating a business plan for an effective sales strategy - A good way to do so to is measure the SoS for the competitors. In fact it was through the SoS measurements that one of our clients deduced - that they had high SoS in the orange juice category, but their competitors’ focus was no longer on the orange variant of the juice - they had shifted to the mango and guava flavours as and they were trying to compete more aggressively on those flavours.
Brands should share the SoS data with their retail partners and others in the company - like the brand managers, their market research teams, the business leaders and the analytics team. This will help the CPG leadership to get a complete picture of how their SKUs and their competitors are performing in the market. They will appreciate the data and incorporate it in their consumer business plans.
The goal here is to create a SMART Shelf. According to a report by Nielsen, A planogram will generate a “SMART” shelf only if it has the right balance of art and science. A SMART shelf is – Shopper friendly, Maximizes sales and profits, Avoids out-of stocks, Reduces operational inefficiencies and Triggers experimentation. Thus, a SMART shelf will help shoppers, manufacturers and retailers.
In conclusion, calculating Share of Shelf is an important lever that brands have to help them win the battle on the shelf. The only reason they are often unable to leverage it is the lack of an accurate and effective SoS measurement programme. Using image recognition tools to aid in SoS measurement can be a viable, feasible and accurate solution to all the woes of CPG manufacturers. Eventually, ROI will be generated in the form of increase in market share for their SKUs.
FAQs
What is Share of Shelf in FMCG?
A: The Share of Shelf in FMCG is a KPI that allows you to measure the on-shelf presence of your FMCG brand’s products compared to your competition. It’s an essential metric for FMCG brands/manufacturers to check their presence and visibility in retail stores. Share of Shelf helps understand market trends and consumer behavior, and improve overall sales perforA: Share of Shelf is important because it directly influences product visibility and consumer accessibility. FMCG Brands with a higher SoS are more likely to capture consumer attention, resulting in increased sales and market share. Monitoring SoS helps retailers and brands optimize shelf space allocation, enhance product placement strategies, and stay competitive in the market.mance.
How is the share of the shelf calculated?
A: There are two primary ways to compute Share of Shelf (SoS). Counting the number of facings (single product placements) of a particular brand or product on the shelf and dividing it by the overall number of facings on the shelf is the first method, known as the Share of Facings Count. The second method is the linear SoS method, which involves measuring and dividing the linear length of the shelf that is occupied by a particular brand or product.
Why is Share of Shelf important in retail?
A: Share of Shelf is important because it directly influences product visibility and consumer accessibility. FMCG Brands with a higher SoS are more likely to capture consumer attention, resulting in increased sales and market share. Monitoring SoS helps retailers and brands optimize shelf space allocation, enhance product placement strategies, and stay competitive in the market.
Liked the blog? Check out our other blogs to see how image recognition technology can help brands improve their execution strategies in retail.
Want to see how your own brand is performing on the shelves? Click here to schedule a demo for ShelfWatch.


.jpg)
.jpg)