Like this article? Share it with your network.
This is a common anecdote used by market researchers when quantifying the importance of getting the retail strategy right. Even if the 70% figure is an overestimate and the actual number is closer to 50%, the key message for us is that getting a brand’s retail presence right is as important as creating the brand image itself through advertising and shaping the messaging.
Within retail, how a brand shapes its presence on the shelf is very important. But there is a big blind spot — getting objective insights about the quality of a brand’s shelf presence on a large scale is extremely challenging.
With this blog, we introduce an AI-based automated retail shelf monitoring solution that makes the process of analyzing retail shelf images extremely efficient and flexible. At ParallelDots we strongly believe that the process of collecting and analyzing market research data will be greatly influenced by Artificial Intelligence. We are here to drive this change.
Traditional ways of deriving retail presence insights are inefficient and expensive
Brands and agencies typically do shelf measurement by getting their representatives or partners to get images of retail shelves from different regions of the country and then code the attributes (brand facings, area, count, on-shelf availability, price display detection) manually. Doing so is costly, time-consuming and an inflexible approach. With the latest advancements in computer vision, the time has come to let the algorithms do the attribute coding.
Conceptual Case Study
Analyzing reasons for a decline in sales of RedBull with the help of automated retail shelf monitoring

An overview of how AI drove automated retail shelf monitoring can deliver high-value insights.
Suppose RedBull notices a decline in its sales volume across USA over the last couple of months. This was a puzzling situation for the company as their market research had confirmed the following hypotheses about the brand -
- Retail sales measurement data confirmed that the reach and stock levels of RedBull’s products remained healthy.
- The company’s advertising and promotion effectiveness has only increased over the past few months.
- Customer surveys have revealed that the perception towards the RedBull brand has only improved over the past month.
- There has been no notable change in competition dynamics for the energy drinks market.
- Retail sales data also confirmed that other competing brands’ sales have also slowed.
In light of the above findings, the executives at Red Bull concluded that there could be issues with retail positioning. However, they were puzzled about how to objectively measure its retail presence quality and examine this hypothesis. They turn to a market research agency for help.
The research agency maintains a monthly database of images of shelves from ~5,000 retail stores across US. It decided to analyze the images of refrigerated shelves (that carry energy drinks) over a span of the last 6 months. It then deployed ParallelDots computer vision technology to get insights about the visibility and quality of RedBull’s shelf presence compared to competing brands for energy drinks and substitute products.
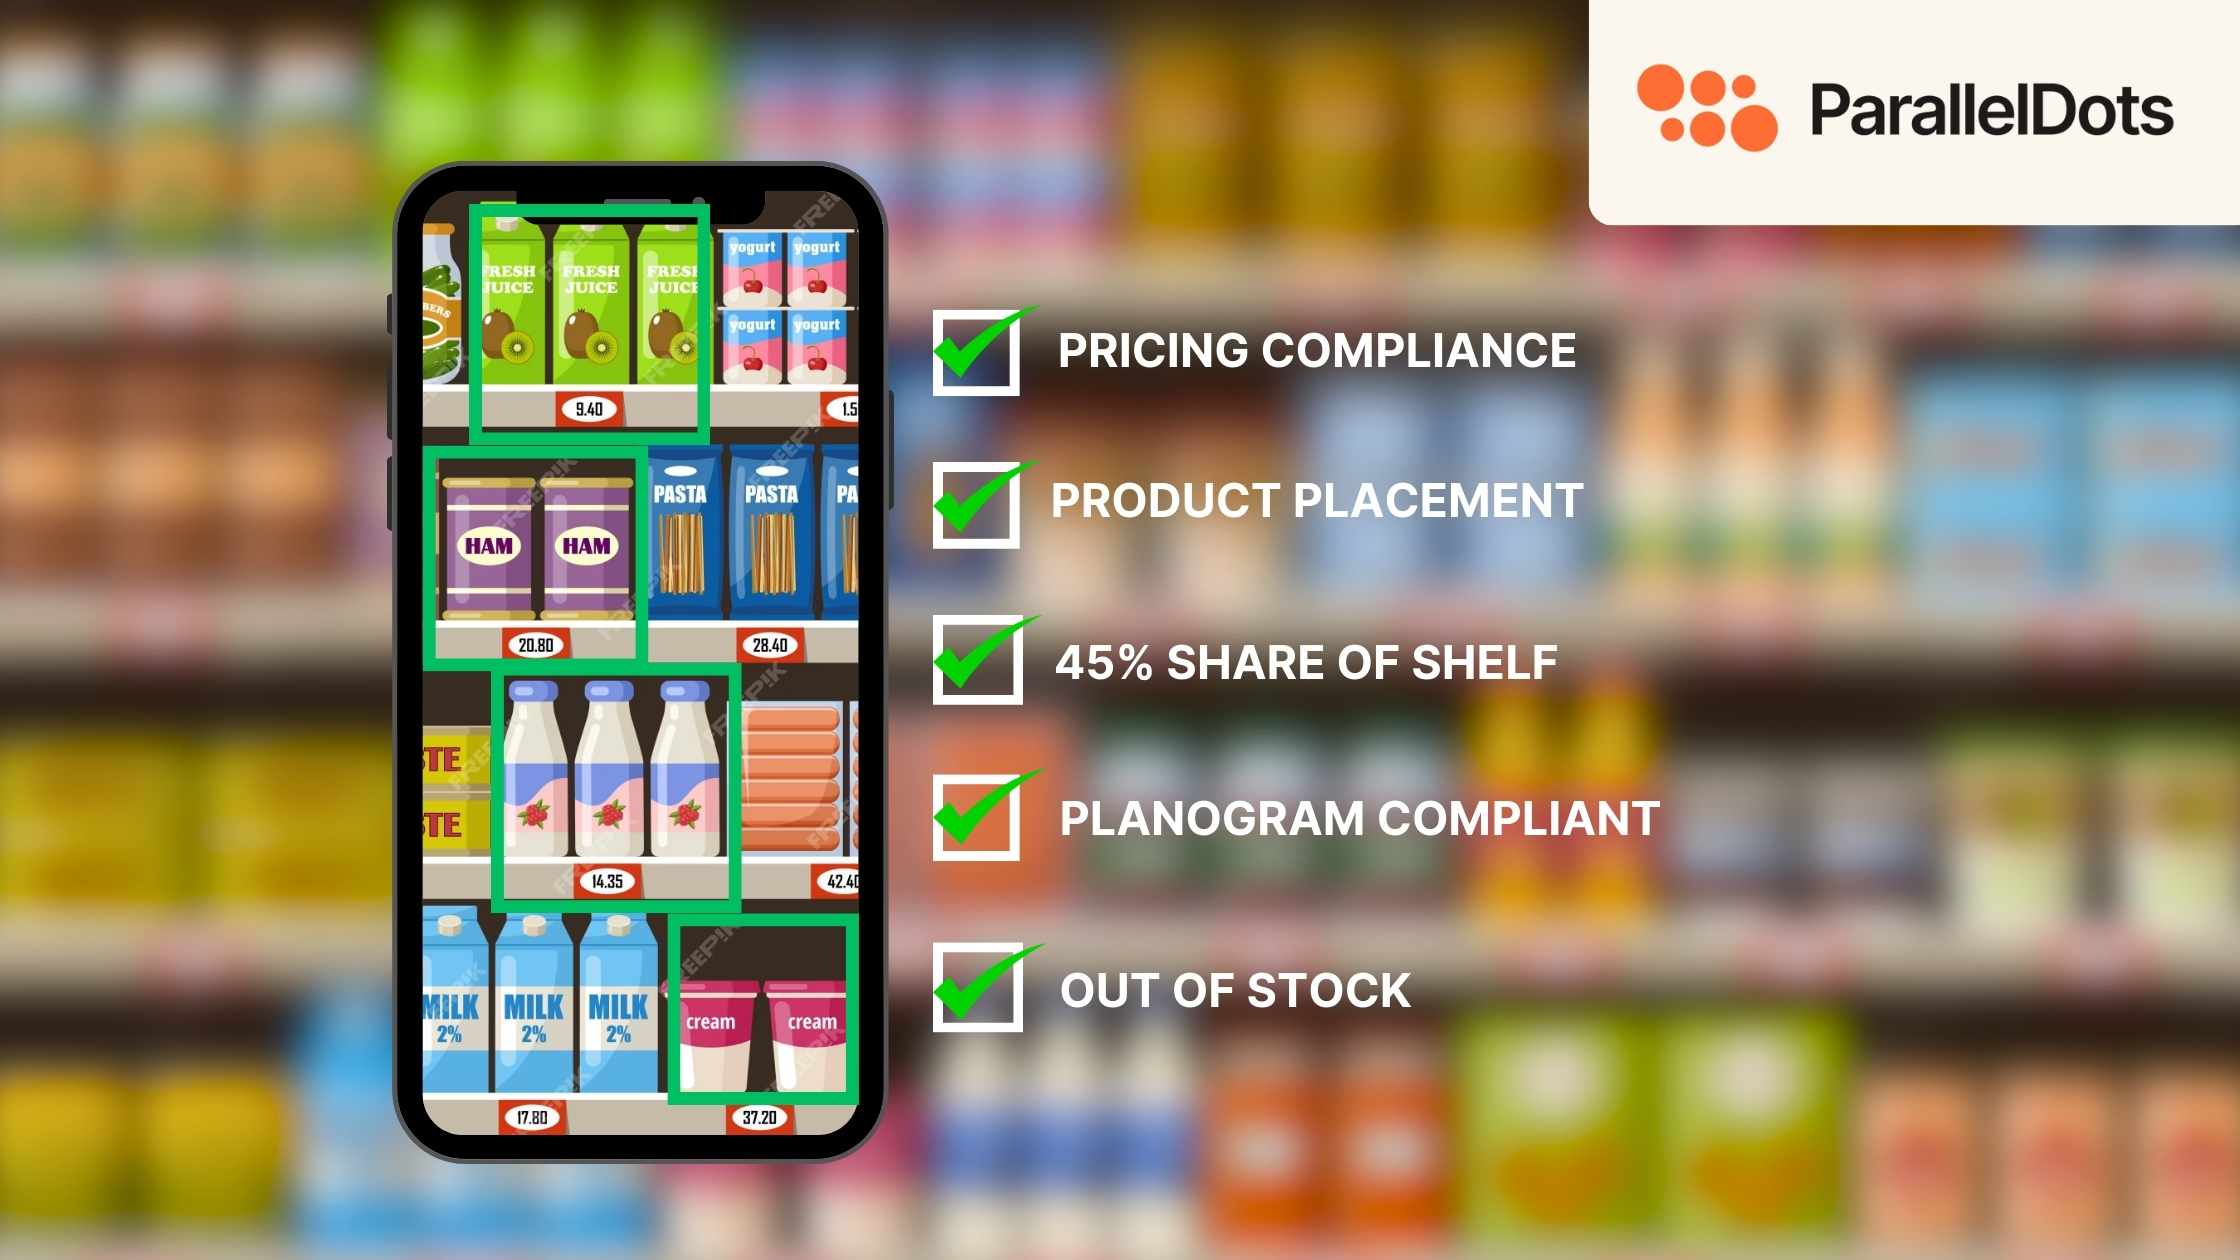
ParallelDots Computer Vision technology for Automated Retail Shelf Monitoring

ParallelDots algorithms are designed to take an image of a shelf as input and identify the visible products. Along with identifying any fully visible product, it also gives the corresponding count, area, and height.
The algorithm performs well even in practical scenario conditions where lighting is not ideal (for shelf image), products are kept in different orientations (tilted, backward) and the image is zoomed out.
A visual representation of how the algorithm detects the shelf presence of particular products:
Analyzing RedBull’s Shelf Presence
ParallelDots Shelf Monitoring algorithms were used to analyze ~5,000 refrigerated shelf images for the last six months. This converted all the qualitative data about shelf visibility of RedBull and its substitute products into quantifiable metrics. The researchers now deploy data analytics techniques to uncover insights.
Firstly, the researchers analyzed RedBull’s Visual Share of Shelf (VSS). VSS for a product is identified as the visible area of the product as a percentage of the visible area of all the products on the shelf.

The researchers’ suspicion was true. The visibility of RedBull relative to other substitutes had declined over the past few months. The same was the case for other energy drink brands as well. Now the question is, what is causing this shift?
By further breaking down the VSS of other drinks, the researchers noticed that there was strong growth in shelf visibility of Coffee and Protein-based Health Drinks. Almost all the decline in the shelf visibility of energy drinks was at the expense of the rise in these two emerging beverage categories.
See the table to understand the shelf visibility of SKUs other than energy drinks on the refrigerated shelf:

Coffee and protein-based health drinks have indeed been one of the fastest-growing beverage categories. Over the last six months, many CPG giants had invested in bringing new products in these categories along with aggressive advertising and retail partnerships to gain leadership in this fast-growing space.
Energy drinks are known to have a niche market of their own. The executives at RedBull paid little attention to the rise of new categories. They got blindsided by this shift. Armed with insights from AI-driven shelf monitoring, the executives now decided to gather some further insights into corrective actions.
Further Insights for guiding corrective actions
By now, it was established that energy drinks were being given less retail space to make way for increasing product offerings in the Coffee and protein-based health drinks categories. Doing some number crunching revealed that the decline in VSS was most pronounced in smaller stores in smaller US cities. This is one area where RedBull has little visibility and control over the retailer’s shelf decisions.
One of the researchers also suspected that Red Bull was also being given unattractive positions on the shelf to make space for the emerging categories. “Eye Level is Buy Level” is a common saying in the retail industry. Any brand prefers to place its products at or near the eye to increase the likelihood of consumers choosing the products and RedBull is no different. The researcher decided to measure the average height at which RedBull’s products were being displayed on the shelves.
The analysis below shows that Red Bull’s presence in the preferred eye level zones (4–8 level) has also reduced considerably. This is an important insight which further explains the reason for the drop in the product’s sales.

The table below highlights the fact that the presence of Red Bull’s SKUs at eye level has significantly reduced.

Conclusion
With AI-driven automated retail shelf monitoring, the agency was able to prove the hypothesis that Red Bull’s deteriorating shelf presence was primarily responsible for the decline in the product’s sales. More importantly, the agency was able to do this in a time-bound and cost-effective manner while also identifying the underlying reason and getting further insights for taking corrective actions. We at ParallelDots, believe that AI is going to be a big driving force in the future of market research and we are here to facilitate that change.
Liked the blog? Continue reading other blogs and see how ShelfWatch can help you monitor retail shelves.
Want to see how your own brand is performing on the shelves? Click here to schedule a free demo.


.jpg)
.jpg)